 Community finding and group centrality analysis of the C. elegans PPI network
Pyntacle version: 1.0
Table of Contents
- Introduction
- Data Description
- Capturing the global properties of the C. elegans interactome with
pyntacle metrics - Run the fastgreedy algorithm with
pyntacle communities - Searching for node set inside a community to spot important groups of nodes using reachability key player indices
- "Differential centrality analysis" of key players nodes: Their role in their community and in the whole graph
- Conclusions
Note to the reader: the purpose of these case studies is not scientific, but demonstrative of the functionalities of Pyntacle.
Introduction 
In this case study, we will show how group centrality metrics (such as the key player centrality indices), coupled with other knwon global and local centrality network measures can be used to find novel insights and redefine our current knowledge on well-known molecular network models.
Pyntacle will be used in its command line form to analyze the Protein-to-Protein Interaction (PPI) network of a model organism, the worm Caenorhabditis elegans. This network contains only binary relationships and is compliant with the Pyntacle minimum requirements.
To summarize, the analysis workflow will be the following:
- Compute global centrality indices of the C.elegans PPI by means of the
pyntacle metrics globalutility - Spot group of tightly-connected nodes (modules) in the interactome (modules) by running
pyntacle communities - Find the most central groups of nodes in the community in terms of key-players indices using the
pyntacle keyplayer kp-findercommand - Compare some of the implemented local centrality indices of the node set found in the community with respect to the whole interactome
- Compare key player valuesfor the node set in the community with respect to the whole interactome
We refer the user to our short introduction on key players and other group centrality indices and to our Pyntacle quick startup guide before reading this case study to get acquainted with both key player centrality indices and some of the basic Pyntacle functionalities.
Data Description 
The data used in this case study is the PPI network of Caenorhabditis elegans downloaded from the APID database on May 2018. The interactome is of high quality (Level 2 Intectome) and the edge among each protein pair is drawn if the interaction is reported by at least 2 experiments.
We extracted and focused on the network's largest component and discarded the other small components and node isolates, leaving to an undirect, single-component network made of 3303 nodes and 5561 edges. Then, PPIs were converted to an adjacency matrix using a custom python script.
The clean network is available here. The whole data produced in this case study can be downloaded here.
Capturing the global properties of the C. elegans interactome with pyntacle metrics 
First, we will measure some of the basic global features of the C.elegans PPI network to capture its complexity and to grasp the information for choosin the most suited community-finding method across the variety of module detection methods that we wrapped in pyntacle communities.
To do this, we will make use of the pyntacle metrics utility. This module contains methods to measure both global and local centrality indices, in order to gather both a general view of the network and detailed information on the relative centrality of each single nodes in the network. they are available through the pyntacle metrics global or the pyntacle metrics local power shell commands, respectively.
Some of these metrics are well-known to the network science community, like the node degree or the graph diameter, while many other indices implemented are relatively unknown and were chosen for their potential utility in a network analysis workflow.
To capture the overall global properties of the node, type:
pyntacle metrics global -i APID_CAEEL_Level2_maincomponent.adjm -d ./
Where -d is the directory that will store a text-based output containing all the global metrics computed and, if the network has less than 1000 nodes, a graphical static representation of the output. In this case, and from now on, we assume that the C. elegans PPI network is stored in the directory where results will be generated.
Note that pyntacle metrics global has several option to customize the output and to perform small analysis, like the --no-nodes argument, that allow to compute global metrics before and after a user-defined list of nodes are removed from the input graph. These commands are above the scope of the analysis, however we recommend to have a look at the Pyntacle command line manual to explore the available options.
This command will create a tab-separated file in our directory (you can download it here), storing all the global metrics of our interactome.
The file will contain the following information:
- the first part contain general information about the run and the input graph:
| Pyntacle-Report-Global : 2019-02-19-181524 | |
|---|---|
| Network Overview | |
| graph name | APID_CAEEL_Level2_maincomponent |
| components | 1 |
| nodes | 3303 |
| edges | 5561 |
This little summary is created by default in all the text reports produced by Pyntacle. It tells us general information regarding the input network enabling the user with the possibility of checking if the network has been properly imported by Pyntacle.
- The second part contains the "core" of the analysis, i.e. the global metrics we currently support.
| Metric | Value |
|---|---|
| average shortest path length | 5.20682 |
| diameter | 18 |
| components | 1 |
| radius | 9 |
| density | 0.00102 |
| pi | 308.94444 |
| average clustering coefficient | 0.04584 |
| weighted clustering coefficient | 0.01752 |
| average degree | 3.36724 |
| average closeness | 0.19657 |
| average eccentricity | 13.62458 |
| average radiality | 13.79318 |
| average radiality reach | 13.79318 |
| completeness naive | 0.00102 |
| compactness | 3.36966 |
| compactness correct | 0.00102 |
Note that since Pyntacle is constantly updated, the order and the type of information reported in any command report may change from version to version. We recommend checking the official website or the Pyntacle GitHub page regularly.
Despite its size, the connections among the network seems to be very short (if we look at the network diameter). Moreover, the average degree denote that, on average, each node has at best 3 to 4 connections with other nodes. These two inforomations, when coupled, may imply a well-defined topology, like the Scale-free model. However, these are just speculations and definetly need more insights for the assessment of the network topology.
for determining which community algorithm have the best fit on the network, we could look at information regarding density, for example. But density is not the only proxy we could use among these global metrics. The cells with bold values show the sparseness indices of the C.elegans PPI network. Sparseness metrics aim at providing a measure to rely on when evaluating network's ratio between nodes and edges. In brief, both the completeness naive and the compactness correct range from 0 to 1, with values close to 0 being indicative of a sparse network and values close to 1 indicative of a dense network.
As you can see, the interactome is sparse enough to use the fastgreedy algorithm embedded within pyntacle communities.
Run the fastgreedy algorithm with pyntacle communities 
Global Metrics analysis allowed us to unravel some of the PPI network properties and gave us some hint on what kind of community finding methods to use to partition the graph into submodules. These algorithms (at least, a binch of them being the field of community active very broad) are available in the igraph package and were wrapped in pyntacle communities- The methods encased in Pytnacle were chosen by keeping into account their usage, their popularity and their applications in a network biology context.
In this case study, we will use the fastgreedy algorithm, described by Clauset, Newman and Moore in 2004. This agorithm is suitable for large networks and tries to maximize the moduliarity score of communities. It runs in linear time on sparse networks. In pyntacle communities, this algorithm can be tuned in order to adapt it to the network of interest. A complete list of these parameters can be explored both by running the pyntacle communities fastgreedy --help command for a quick description, or again by looking at the Command line manual on the Pyntacle official website.
We can therefore launch the algorithm on the C.elegans interactome by typing the following command:
pyntacle communities fastgreedy -i APID_CAEEL_Level2_maincomponent.adjm -d ./CAEEL_communities -o CAEEL_Interactome --min-nodes 40 --plot-format png
(this can take some time, according to your machine. Don't worry! Pyntacle is running nonetheless)
where -d is a new directory that will be created inside our current working directory, -o is the basename of the network files (by default, ajacency matrices) that will be created inside this directory, each storing a founde community and the --min-nodes argument filters all the communities by keeping those with at least 40 nodes.
The following text output will be produced on your shell (for the sake of readability, we report here only the run summary, buyt Pyntacle command shell is longer, also adding information on each step of the run:
****************************************** RUN SUMMARY *******************************************
Pyntacle - Community finding report:
Algorithm:fastgreedy
Total number of communities found: 43
Index Nodes Edges Components
0 357 477 1
1 537 920 1
2 131 170 1
3 30 29 1
4 89 100 1
5 337 512 1
6 146 171 1
7 79 81 1
8 65 82 1
9 220 270 1
10 38 37 1
11 92 92 1
12 57 57 1
13 91 91 1
14 44 46 1
15 119 139 1
16 50 51 1
17 4 3 1
18 55 55 1
19 104 108 1
20 100 103 1
21 73 73 1
22 59 61 1
23 91 95 1
24 40 39 1
25 53 52 1
26 70 74 1
27 44 43 1
28 6 5 1
29 6 5 1
30 21 30 1
31 3 2 1
32 41 40 1
33 4 3 1
34 5 4 1
35 4 3 1
36 7 6 1
37 6 5 1
38 8 7 1
39 3 2 1
40 5 4 1
41 5 4 1
42 4 3 1
Filtering subgraphs according to the specified criteria, enlisted above:
minimum number of nodes per module: 40
maximum number of nodes per module: NA
minimum number of components: NA
maximum number of components: NA
Filtered out 18 communities. Keeping 25 communities
****************************************************************************************************
The report first acknowledge that the algorithm found 43 communities in the C.Elegans interactome, numbered from 0 to 42. Out of these 43, by means of the --min-nodes parameter, 18 communities were filtered out (namely, communites #17 and then #28 to #42).
The remaining ones will be in the CAEEL_Communities subdirectory. Inside, we will find an adjacency matrix for each community named CAEEL_Interactome + the integer ID that allows to trace and distinguish each subgraph from each other. moreover, a text report (downloadable here) will be produiced in the same subdirectory, containing the information o n the filtered final modules)
Inside the CAEEL_Communities directory there will also be a sibdirectory, called pyntacle-plots containing a statical network representation for each of the community that is below 1000 nodes. Here's for example the static plot of the first community found (numerical ID: $0$), with 357 vertices and 477 edges:
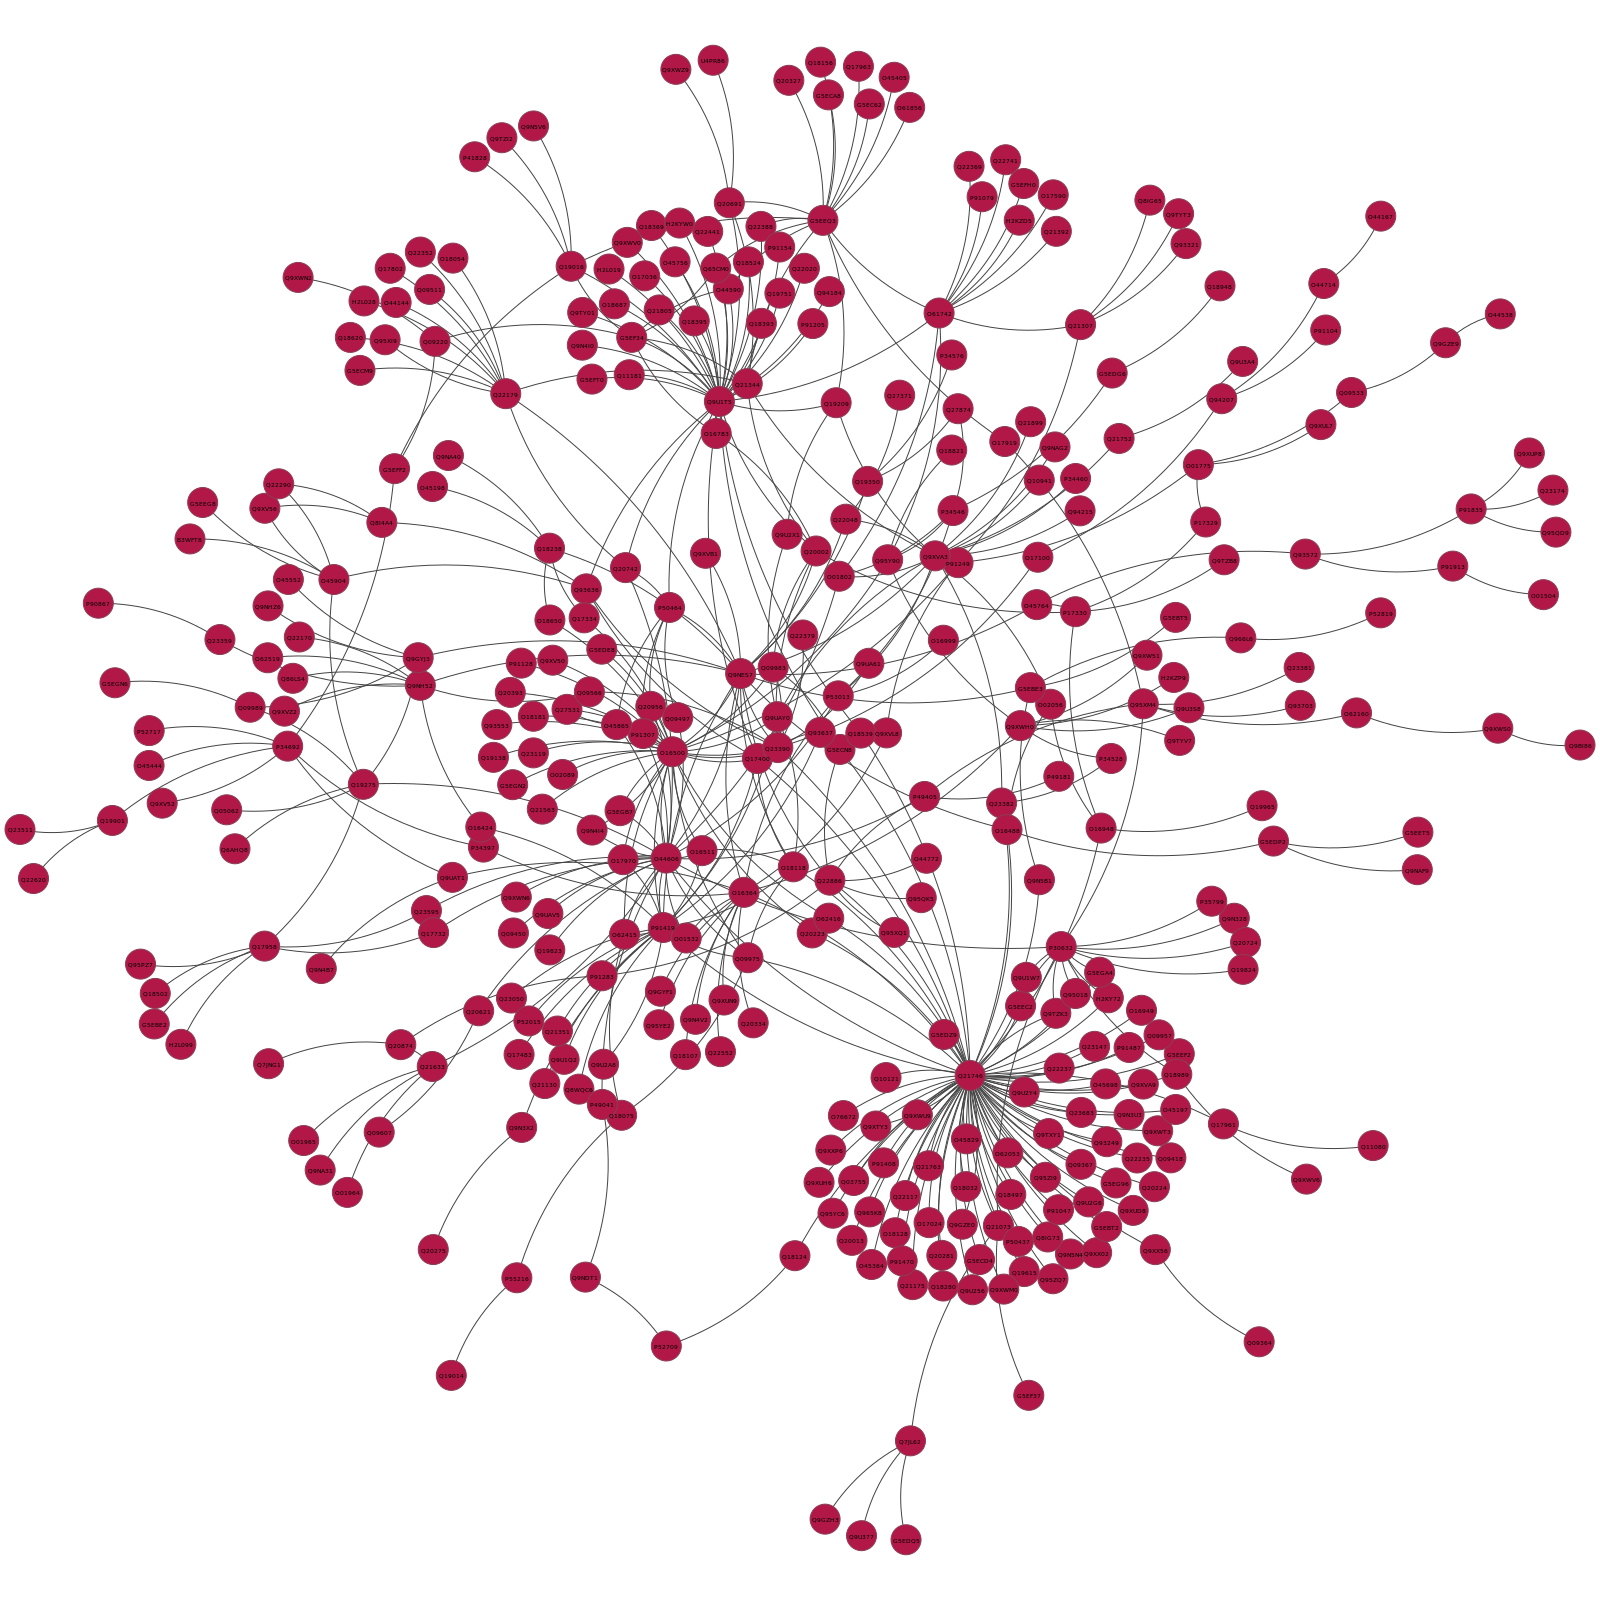
Note that the nodes in each distinguished module will have different colors, to distinguish them clearly from other communities.
Searching for node set inside a community to spot important groups of nodes using reachability key player indices 
Module decomposition enabled to categorize the whole interactome into distincs subcomponents.These communities can then be functionally enriched (i.e., by passing the gene IDs to some gene ontology software), to spot communities that are mostly functionally related to processes of interest. We can, however, also explore the intra-group relationshps among proteins that belongs to the same module. While several local centrality proxies are available in Pyntacle to measure the importance of single nodes in a community, we can also explore the effects that groups of nodes on overall exhibit on the network by means of group centrality indices, such as key players centralities. We can furthermore search for a sey of nodes that maximize the fragmentation or the reachability inside a submodule.
In this case study, we have findings that the 3rd found community (available here) is related to the C. elegans embryo development and we want to search for the proteins that are central in this subnetwork, thus orchestrating the development of the embryo. A first question that comes to mind is whether there are group of proteins here that coordinates the other members of the subnetwork, thus pinpointing at some regulators that coordinates the embrionic development. In this case, we would be interested in using the two reachability metrics implemented, namely dR and m-reach. We can use Pyntacle, with his greedy optimization search algorithm, to find these nodes, i.e. what are the 3 nodes that maximally reaches the community. We refer the reader to the Group Centrality Guide for knowing more on the utility of group centrality indices and of reachability metrics in particular.
We can therefore use the pyntacle keyplayer kp-finder command to find relevant group of nodes of size 3 that reaches optimal scores of reachability. On your shell, this is performed by typing:
pyntacle keyplayer kp-finder -i CAEEL_Community_2.adjm -k 3 -m 2 -t pos -d ./ --seed 100
The -t pos argument will guide Pyntacle in using only the reachability (also called KPP-POS metrics) while the --seed argument sets a seed in order to reproduce the results for the greedy algorithm.
in our drectory we will find a report, downloadable here, in tab-separated format containing the same preliminary report obtained when performing the whole interactome global analysis, plus a second part with the description of our run and the information found for the 2 positive key player metrics:
| Metric | Nodes | Value |
|---|---|---|
| dR | P34766,Q11184,P34278 | 0.61501 |
| m-reach | G5EFF4,P34766,O62305 | 107 |
These results tells us that the node of set that maximally connects the network when accounting for the distance that intercours among them (dR, that range from 0 to 1, where 1 represent maximum communication flow among the network) are P34766, also named pal-1 (a transcriptional activator), Q11184 (let-756, a larval development protein) and P34278, named knl-1, involved in the assembly of the kinetocore. Seems reasonable to think that these proteins could be potential candidates when studying the interactome in the onset of embrionic development.
In the pyntacle-plots directory, we can see a static representation of the nodes found for the dR metric (in yellow), as well as the edges connecting them to the closest nodes:

As for the m-reach (which represent the toal number of nodes reached in 2 steps or less, we see that G5EFF4 (sem-4), pal-1 (again) and O62305 (unc-43) reaches 107 nodes out of 131 (around the 84% of the nodes in the community, considering also the 3 proteins. These proteins are respectively a not-so-well characterized transcription factor, another transcriptional activator responsible of muscle development, and a protein kinase responsible of lifespan processes and response to stress, as well as many other processes.
Again, the pyntacle-plots directory will contain the static network representation of the nodes that maximize the m-reach (in blue), along with the edges that connects the nodes in 2 step (with a bigger width)

All these findings may be used as a cornerstone to focus other kind of in vitro or in vivo studies (i.e.assays to quantify these proteins during embryo development), or in silico to perform a (improperly named here) differential centrality analysis as we will discuss in the final part of this case study.
"Differential centrality analysis" of key players nodes: Their role in their community and in the whole graph 
The centrality findings of the group centrality node set search by means of the class of reachability indices were useful to characterize the role of group of node inside the community. But is the role of the previously found proteins important as well in the whole network? What is the reachability in the same set? Can we link reachability to other well known centrality metrics and assess its importance?
We can compare the connectivity of the proteins of our node sets for one of the reachability metrics (let's say dR) in our community and their role in the whole interactome by means of the pyntacle keyplayer kpinfo command. This tool is specifically designed to obtain the value of key player centrality indices for a set of nodes of choice.
pyntacle keyplayer kp-info -t dR -i APID_CAEEL_Level2_maincomponent.adjm --nodes P34766,Q11184,P34278 -d ./
Here, the --nodes parameter specifies the node names of the proteins found to optimize dR inside the Community #2 of the C. elegans Interactome.
The corresponding output to shell is the following:
****************************************** RUN SUMMARY *******************************************
The dR value for node set:
(P34766, Q11184, P34278)
is 0.31408
****************************************************************************************************
(This is an exceprt of the report that report the run summary of the whole Pyntacle pipline).
The text report produced by the kpinfo command is available here
As we can see, the dR value for this group of nodes is actually lower than the one found inside the community (~0.62 inside the community vs ~0.31). This finding highlights the importance within the community of the node set with respect to the whole network.
At this point, we can compare the findings for the node set with the individual centrality indices commonly used to find central nodes, such as node degree or betweenness. To this extent, we will make use again of pyntacle metrics local, another utility of the pyntacle metrics command seen before, this time for local centality indices.
We can run this command to search for centrality indices of the spoitted proteins of interest at first in the whole interactome, by passing the proteins as a comma-separated list of nodes to the --nodes argument, typing:
pyntacle metrics local -i APID_CAEEL_Level2_maincomponent.adjm --nodes P34766,Q11184,P34278 -d ./
and the same command at community level:
pyntacle metrics local -i CAEEL_Community_2.adjm --nodes P34766,Q11184,P34278 --no-plot -d ./
(we're not interested in the graphical network representation, so we add the --no-plot argument in the second command. In the ocal metrics analysis for the whole interactome, the plotting will be skipped, as the network is too big to graps a clear visualization of it.)
For the whole network, the metrics reported for our 3 nodes of choice are:
| Node Name | degree | clustering coefficient | betweenness | closeness |
|---|---|---|---|---|
| P34766 | 52 | 0.00075 | 350972.36317 | 0.26642 |
| Q11184 | 12 | 0.01515 | 50174.85624 | 0.23582 |
| P34278 | 17 | 0.14706 | 28159.30857 | 0.21704 |
while, inside the community, the role of these nodes seems to be different in terms of centrality:
| Node Name | degree | clustering coefficient | betweenness | closeness |
|---|---|---|---|---|
| P34766 | 23 | 0.004 | 6213.858 | 0.43333 |
| Q11184 | 9 | 0 | 1996.65043 | 0.3552 |
| P34278 | 14 | 0.22 | 756.66905 | 0.29083 |
(considering only the most important ones, the rest are omitted. Download here the full report for the whole interactome and here the full report for the nodes within the community.)
These data shows that the community-finding more than halved the degree of one of the members of the node set for dR (P34766). However, the degree of the other member didn't change considerably, meaning that their centrality in the community is indeed important, regardless of their neighbors.
Of course, many other metrics such as the clustering coefficient are scaled to the relative community, implying a different centrality in the two context. However, their values are not high enough in both cases to assume these nodees could be spotted using only local centrality indices.
Conclusions 
In this case study, we tackled to unravel the complexity of one of the most studied example of molecular biological network, a protein-to-protein interaction network (also addressed in this document as PPI network, or interactome). We choose as a case example the high quality (validated) interactome one of the simplest multicellular organism, the nematode Caenorabhdtis Elegans, which is often used to investigate the molecular basics of development, neural formation and neural connection (we will see that the roundworm will be used in a third case study, this time focusing on its neural connection scheme). By means of Pyntacle, we first sought to reduce the complexity of the network to communities of tighly-related nodes by means of the pyntacle communities command, identifying a series of modules that can be functionally enriched to associate molecular functions to each one of them. We then focused our attenton to a module that we found to be associated to the embrioic and neural development. We characterized key proteins in this subcommunity using the reachability indices embedded in the pyntacle keyplayer kp-finder command, and higlighted the role of two partially overlapping sets of proteins. We then compared the reachability of these nodes within the commnity to their reachability in the whole connectome, showing that their inter-module effect is higher compared to the one they have on the whole network. Finally, we compared the findings obtained using group centrality indices to the ones that could be obtained with local centrality metrics, finding that local centralities, alone, could not explain the apical role of these nodes in the two networks.
This analysis is a proxy for a network-based molecular analysis,and many other conclusion culd be drawn that are outside the scope of this case study. For example, one could be interested in checking the role of the high-reachability nodes with respect to other high reachability nodes in the community, identifying groups of key nodes in each module and explored the distance among them, as well as the role of the bridging proteins (proteins in the middle) of these twosystems. Moreover, a series of in silico networks could be drawn for each community of interest to compare the structural differences among them, in order to capture if the relationships among proteins are due by chance or they rather imply a link between the geometry of each module and their functional importance.
This ends our case study 2. If you want to leave a feedback, please contact us. Any suggestion and critic is highly appreciated!